Sky science
Graphs
What every graph and readout in the app plots, how each value is calculated, and what it means for the night, including the ones that are mock or unused.
What exists
| Surface | Where | Data behind it | Status |
|---|---|---|---|
| Conditions graph | atmospherics sheet | hourly cloud cover, the moon's altitude, the prime-view window | real |
| Rise and set cards | atmospherics sheet | ephemeris sunrise, sunset, moonrise and moonset | real |
| Seeing, darkness, humidity and temperature tiles | atmospherics sheet | current forecast hour, zone and moon | real |
| Hourly forecast list | atmospherics sheet | hourly forecast | real |
| Object visibility graph | object detail screen | the object's altitude, a moon value, hourly cloud cover | real |
| Cloud bar, visibility and moon cards, highlights | home screen | forecast, zone, ephemeris | real |
| Altitude graph | nowhere | a sine wave and a fixed shape | mock and unused |
| Cloud cover graph painter | nowhere | hourly cloud cover | unused |
The sections below follow the code. Colours are given by role, because the interface is being redesigned and today's colours come from a default palette that the design system replaces.
Shared conventions
- The window is the night. Both real graphs span the night window: from sunset on the selected date to the next sunrise, from the ephemeris (see Planets and the sky). The horizontal position of a point is its minutes since the start divided by the minutes in the window.
- Time labels. The conditions graph shows five labels, evenly spaced, as hours such as 18:00. The object graph shows five labels the same way.
- Sampling. Altitudes are sampled every 15 minutes. Cloud cover is sampled hourly. Between samples the graphs draw straight or smoothed lines, and never compute extra points.
- Heights. Each graph is 200 px tall in a rounded glass card. The conditions graph reserves the bottom 30 px of its plot for the time labels.
- Now. A vertical line marks the current time when it falls inside the window.
- Legend. Labels sit above the graph and name each layer.
Conditions graph
This is the graph at the top of the atmospherics sheet. It answers one question: when tonight are the skies clear and the moon out of the way?
| Layer | What it plots | Vertical scale | Meaning |
|---|---|---|---|
| Cloud cover (legend CLOUD COVER, faint white) | the hourly cloud forecast as a filled area | 0% at the bottom, 100% at the top of the plot | the higher the area, the cloudier; a flat low line is a clear night |
| Moon (legend MOON, indigo) | the moon's altitude above the horizon, from the same trajectory the moon's own page uses, floored at 0 | 0° at the bottom, 90° at the top | the area is where the moon is up; a tall area means a high moon |
| Moonrise marker | a short line, a dot and the words MOON RISE at the time the moon rises, if that is inside the window | low in the plot | after this the moon starts to wash out faint objects |
| Prime view | a highlighted band with a badge over the best window | full height | the stretch the app recommends (next section) |
| Now | a line labelled NOW | full height | the current time |
The sample night above is drawn by the same code as the app's graph. See App components for the layer variants.
Reading it. You want a low cloud area and the moon area either absent or low. A tall moon area under low cloud means a bright, high moon. A prime-view band that sits where the moon area is zero is the best case.
Not on the graph. The graph does not show the moon's phase. A full moon and a thin crescent draw the same area, because only altitude is plotted. The phase enters the prime-view calculation, not the picture.
Prime view
Prime view is the app's recommended stretch of the night. It uses the hourly samples inside the night window.
| Symbol | Meaning | Unit |
|---|---|---|
| forecast cloud cover at hour | percent | |
| the moon's illuminated fraction, one number for the night | 0 to 1 | |
| the moon's altitude at hour , linearly interpolated between the 15-minute points | degrees |
In words: Lower is better, and 0 is a perfectly clear sky with no moon above the horizon.
Choosing the window:
- Try every run of consecutive hourly samples that is at least 3 samples long, which spans 2 hours.
- Take the run with the lowest average score. Ties keep the shorter, earlier run.
- If that average is above 0.8, show nothing: the night is too poor.
The window is always short. Any run of six or more samples can be cut into runs of three to five samples, and the best of those has an average no higher than the long run's. So the chosen window is always 3, 4 or 5 samples long, which is 2 to 4 hours. The method finds the best short stretch, not the longest good one.
The weights 0.7 and 0.3 and the cut-off 0.8 are fixed numbers with no stated basis, and the score is not in physical units.
The rest of the atmospherics sheet
Rise and set cards. Four cards in a row: SUNRISE, SUNSET, MOONRISE and MOONSET, as local times from the ephemeris.
Tiles. Four tiles in two columns, all for the current forecast hour:
| Tile | Value | Bar and colour |
|---|---|---|
| Seeing | 1 to 10 and a label, from the ground-weather proxy (see Weather and clouds) | bar is score over 10; light green from 8, amber from 5, faint white below 5 |
| Darkness | sky brightness in mag/arcsec² and a label | bar maps 17 to 22 onto empty to full; colour from the label |
| Humidity | percent | none |
| Temp | degrees Celsius | none |
The darkness value is the zone's sky brightness minus a moon penalty of while the moon is up, where is the illuminated fraction and the moon's altitude. Its labels are Excellent from 21.5, Good from 21.0, Fair from 20.0, Poor from 19.0 and Very Poor below. The penalty is a heuristic, not a physical model; the sky model replaces it.
Hourly forecast list. Up to 24 rows starting from half an hour ago. Each row shows the time, cloud cover in percent, temperature, wind speed and the seeing label, and the current hour is highlighted.
Object visibility graph
This is the graph on an object's detail screen, titled Visibility. It answers: when tonight is this object high, and what is in the way?
| Layer | What it plots | Vertical scale | Meaning |
|---|---|---|---|
| Cloud (legend CLOUD, faint white) | the hourly cloud forecast as a smooth filled area behind everything, with a stroke | 0% at the bottom, 100% at the top of the plot | as on the conditions graph |
| Moon (legend MOON, indigo) | the moon value: the moon's altitude times its illuminated fraction while it is up, 0 otherwise | 0 at the bottom; a value of 90 reaches 70% of the plot height | higher means a brighter, higher moon; a thin crescent stays flat even when high |
| Object (legend OBJECT, blue) | the object's altitude, every 15 minutes | 0° at the bottom; 90° reaches 70% of the plot height | the higher the line, the less air the light crosses |
| Peak | a dot at the highest point inside the window | as the object | the best moment for altitude |
| Current position | a dot on the curve at the current time, by linear interpolation | as the object | where the object is right now |
| Now | an orange line that fades out downward, with a NOW label | below the top badge | the current time |
| Moonrise | a marker with the words MOON RISE | low in the plot | when the moon rises |
The graph stops at 70% of its height for 90° so that peak and labels have room. The scale is therefore the same for the object and the moon value but shows each as a share of 70%, not of the full height.
Both variants as the app draws them: the full visibility graph above and the single-curve altitude graph below. Move over either to scrub. See App components for the controls and the horizon view.
Scrubbing. Dragging or tapping shows a line, a dot on the curve and a tooltip with the time and the altitude at the nearest 15-minute point, to a tenth of a degree. The graph also refreshes every minute so the Now line and the current-position dot move.
Calculated but not drawn. The data also holds "optimal windows": hours when the object is above 30° and the moon value is below 30, and sunrise and sunset times. The code comments call both thresholds arbitrary. The windows are computed and never drawn, so they do not appear anywhere on screen.
The two moon curves. The conditions graph plots the moon's altitude. The object graph plots altitude times illuminated fraction. Both are labelled MOON, and they differ for any moon that is not full.
Dashboard readouts
| Readout | What it shows | How it is calculated |
|---|---|---|
| Cloud bar | cloud cover, with a bar filled to the percentage | the current hour for today, or the day's average for another date |
| Visibility card | a sky type, and five bars | zone to bars: 5 minus the floor of (zone minus 1) over 2, clamped 0 to 5, so zones 1 and 2 give 5 bars, 3 and 4 give 4, 5 and 6 give 3, 7 and 8 give 2, and 9 gives 1 |
| Zone and brightness bar | the zone number and the sky brightness in mag/arcsec², with a short label | straight from the zone data |
| Darkness card | a label, the sky brightness and a figure called Ratio | zone data; the figure is shown only when above zero, and it is in fact the radiance in nW/cm²/sr, because of the naming mix-up on Zone scale |
| Moon cards | a moon picture, the phase name and the illuminated percentage | the illuminated fraction times 100, and the phase angle in the bands below |
| Highlights | up to three bright objects | see below |
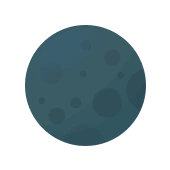
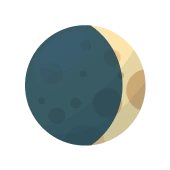
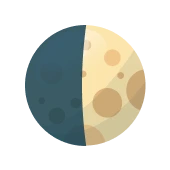
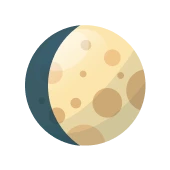

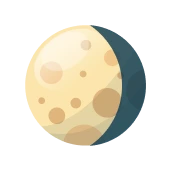
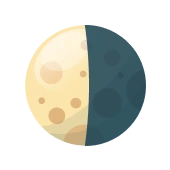
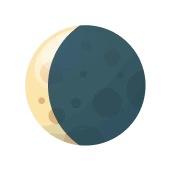
Moon phase names come from the phase angle in degrees: new moon at 355 or above and 5 or below, waxing crescent above 5 and below 85, first quarter from 85 to 95, waxing gibbous above 95 and below 175, full moon from 175 to 185, waning gibbous above 185 and below 265, last quarter from 265 to 275, waning crescent above 275 and below 355. Each band selects one of eight pictures.
Highlights pick objects from the ephemeris list that is above 10° altitude and not the Sun, sort them by magnitude (lower is brighter), and show the three brightest. When the Sun is above −6° (daytime) only the Moon qualifies, since the planets are washed out. Only the Sun, Moon and planets are in that list: stars and deep-sky objects are not.
Three label sets for one zone
The same zone gets different words in different places, and one set still uses Bortle-style names.
| Zone | Visibility card and zone bar (the card adds the word Sky) | Darkness card |
|---|---|---|
| 1 | Dark Sky | Excellent |
| 2 | Dark Sky | Truly Dark |
| 3 | Rural | Rural |
| 4 | Rural | Rural/Suburban |
| 5 | Suburban | Suburban |
| 6 | Suburban | Bright Suburban |
| 7 | Urban | Suburban/Urban |
| 8 | Urban | City |
| 9 | Urban | Inner City |
The home screen's sky state (see Sky states) is a third description of the same sky. A redesign should use one vocabulary.
Mock and unused
- Altitude graph. A widget that draws a sine wave with a peak at 80°, a hard-coded "now" a fifth of the way along and fixed 18:00 to 06:00 labels. Its cloud background is a fixed shape. It is not used by any screen and shows no real data.
- Cloud cover graph painter. Draws hourly cloud cover with a "NOW" line, but nothing uses it.
- Optimal windows. Computed for every object and never drawn (above).
What each becomes
| Graph | Definition under the sky model |
|---|---|
| Cloud cover | the hourly cloud fraction over the night, with the 0.30, 0.50 and 0.70 cuts that set the sky state |
| Moon | the moon's cost in magnitudes of sky brightness at the zenith, in mag/arcsec², so the curve means something in physical units and depends on the phase |
| Sky brightness | the effective sky brightness over the night |
| Best window | the window with the greatest utility, shaded on the time axis, replacing prime view |
| Object altitude | altitude over time with airmass on a second axis |
| Object windows | hours when the object is at least 30° up and the moon adds at most 0.5 mag at the object's own position (proposal), drawn this time |
The moon's cost at an object uses the angle between the moon and the object, so an object far from the moon is barely affected. The formulas are on Moonlight and sky brightness.
Implementation
Excerpts of the real files, cut out by name, copied into the site and checked against the repository on every build.
_drawMoonCurve(canvas, width, height);// 2. Draw Cloud Cover (Area Chart)_drawCloudCover(canvas, width, height);/// Combines cloud and moon scores with appropriate weighting/// Cloud cover is weighted more heavily (70%) than moon (30%)double _calculateCombinedScore(double cloudScore, double moonScore) { const double cloudWeight = 0.7; const double moonWeight = 0.3; return (cloudScore * cloudWeight) + (moonScore * moonWeight);}// Find the best contiguous windowreturn _findBestContiguousWindow(scores, minWindowHours);// 3. Draw Object Curve_drawObjectCurve(canvas, size);// 2. Draw Moon Interference (if any)_drawMoonInterference(canvas, size);// 6. Draw Peak Altitude (Blue Circle)_drawPeakIndicator(canvas, size);void _updateScrubber(double dx, double width, VisibilityGraphData data) { if (width <= 0) return; final double position = (dx / width).clamp(0.0, 1.0); final int totalDuration = data.objectCurve.last.time.difference(data.objectCurve.first.time).inMinutes; final int minutesFromStart = (position * totalDuration).round(); final DateTime time = data.objectCurve.first.time.add(Duration(minutes: minutesFromStart)); // Find closest altitude point double? altitude; try { final GraphPoint point = data.objectCurve.reduce((GraphPoint a, GraphPoint b) { final Duration diffA = a.time.difference(time).abs(); final Duration diffB = b.time.difference(time).abs(); return diffA < diffB ? a : b; }); altitude = point.value; } catch (e) { // ignore } setState(() { _scrubberPosition = position; _scrubbedTime = time; _scrubbedAltitude = altitude; });}@overrideFuture<Either<Failure, VisibilityGraphData>> calculateVisibility({ required CelestialObject object, required GeoLocation location, required DateTime startTime, DateTime? endTime,}) async { try { final Duration duration = endTime != null ? endTime.difference(startTime) : const Duration(hours: 12); // 1. Calculate Object Trajectory List<GraphPoint> objectCurve; // Check for Ephemeris ID first (Planets, Sun, Moon) if (object.ephemerisId != null) { final HeavenlyBody? body = _mapToHeavenlyBody(object); if (body != null) { objectCurve = await _astronomyService.calculateAltitudeTrajectory( body: body, startTime: startTime, lat: location.latitude, long: location.longitude, duration: duration, ); } else { return Left(CalculationFailure('Failed to map object with ephemerisId to HeavenlyBody: ${object.name}')); } } // Check for RA/Dec (Stars, DSOs) else if (object.ra != null && object.dec != null) { objectCurve = await _astronomyService.calculateFixedObjectTrajectory( ra: object.ra!, dec: object.dec!, startTime: startTime, lat: location.latitude, long: location.longitude, duration: duration, ); } else { return Left(CalculationFailure('Unsupported celestial object: ${object.name} (No Ephemeris ID or RA/Dec)')); } // 2. Calculate Moon Trajectory final List<GraphPoint> moonCurve = await _astronomyService.calculateMoonTrajectory( startTime: startTime, lat: location.latitude, long: location.longitude, duration: duration, ); // 3. Calculate Optimal Windows // Logic: Object Altitude > 30 AND Moon Interference < 30 (arbitrary threshold, maybe 10?) // Let's use 30 for now as per previous mock logic. const double minObjectAltitude = 30; const double maxMoonInterference = 30; final List<TimeRange> optimalRanges = <TimeRange>[]; DateTime? windowStart; for (int i = 0; i < objectCurve.length; i++) { final GraphPoint objectPoint = objectCurve[i]; // Ensure we have a matching moon point (should be same length) final GraphPoint moonPoint = i < moonCurve.length ? moonCurve[i] : GraphPoint(time: objectPoint.time, value: 0); final double objectAlt = objectPoint.value; final double moonInterference = moonPoint.value; final bool isOptimal = objectAlt > minObjectAltitude && moonInterference < maxMoonInterference; if (isOptimal && windowStart == null) { windowStart = objectPoint.time; } else if (!isOptimal && windowStart != null) { optimalRanges.add(TimeRange(start: windowStart, end: objectPoint.time)); windowStart = null; } } // Close open window if (windowStart != null) { optimalRanges.add(TimeRange(start: windowStart, end: objectCurve.last.time)); } // 4. Calculate Sun/Moon Rise/Set Times final Map<String, DateTime?> sunTimes = await _astronomyService.calculateRiseSetTransit( body: HeavenlyBody.SE_SUN, date: startTime, lat: location.latitude, long: location.longitude, ); final Map<String, DateTime?> moonTimes = await _astronomyService.calculateRiseSetTransit( body: HeavenlyBody.SE_MOON, date: startTime, lat: location.latitude, long: location.longitude, ); return Right(VisibilityGraphData( objectCurve: objectCurve, moonCurve: moonCurve, optimalWindows: optimalRanges, sunRise: sunTimes['rise'], sunSet: sunTimes['set'], moonRise: moonTimes['rise'], moonSet: moonTimes['set'], )); } catch (e) { return Left(CalculationFailure('Error calculating visibility: $e')); }}/// Selects the top 3 highlights from a list of celestial positions.////// Logic:/// 1. Filter objects with Altitude > 10 degrees./// 2. Exclude the Sun (as it's not a stargazing target)./// 3. Sort by Magnitude (ascending, lower is brighter)./// 4. Take the top 3.static List<HighlightItem> selectTop3({ required List<CelestialPosition> positions,}) { // 0. Determine if it's "Daytime" (Sun Altitude > -6 degrees, i.e., Civil Twilight) double sunAltitude = -90; try { final CelestialPosition sunPos = positions.firstWhere((CelestialPosition p) => p.body == CelestialBody.sun); sunAltitude = sunPos.altitude; } catch (e) { // Sun not found in list, assume night or handle gracefully } final bool isDaytime = sunAltitude > -6.0; // 1. Filter visible objects final List<CelestialPosition> visibleObjects = positions.where((CelestialPosition pos) { // Ensure body is not null if (pos.body == null) return false; // Always exclude Sun from highlights if (pos.body == CelestialBody.sun) return false; // Basic visibility check (above horizon + buffer) if (pos.altitude <= 10.0) return false; // Daytime Logic: // If it's daytime, ONLY the Moon is visible. // Planets/Stars are washed out by the Sun. if (isDaytime) { return pos.body == CelestialBody.moon; } return true; }).toList(); // 2. Sort by Magnitude (ascending) // Note: For MVP, we treat all remaining bodies (Moon, Planets) as high priority. // We sort purely by brightness. visibleObjects.sort((CelestialPosition a, CelestialPosition b) => a.magnitude.compareTo(b.magnitude)); // 3. Take Top 3 final List<CelestialPosition> top3 = visibleObjects.take(3).toList(); // 4. Map to HighlightItem return top3.map((CelestialPosition pos) => HighlightItem( body: pos.body!, altitude: pos.altitude, magnitude: pos.magnitude, isVisible: true, )).toList();}static String _getMoonPhaseLabel(MoonPhaseInfo info) { final double angle = info.phaseAngle; if (angle >= 355 || angle <= 5) return 'New Moon'; if (angle > 5 && angle < 85) return 'Waxing Crescent'; if (angle >= 85 && angle <= 95) return 'First Quarter'; if (angle > 95 && angle < 175) return 'Waxing Gibbous'; if (angle >= 175 && angle <= 185) return 'Full Moon'; if (angle > 185 && angle < 265) return 'Waning Gibbous'; if (angle >= 265 && angle <= 275) return 'Last Quarter'; if (angle > 275 && angle < 355) return 'Waning Crescent'; return 'Moon';}/// Effective sky brightness in mag/arcsec²: natural + artificial + moon + twilight, in natural units.static double sqmEffective(double rArt, {double bMoon = 0, double bTwilight = 0}) => AstrZoneScale.referenceSqm - 2.5 * _log10(1 + math.max(rArt, 0) + math.max(bMoon, 0) + math.max(bTwilight, 0));/// Per-hour values. [cloud] is a fraction 0 to 1.static SkyHour hourQuality({ required bool dark, required double cloud, required double rArt, required double bMoon,}) { final double sqm = sqmEffective(rArt, bMoon: bMoon); final double nelm = AstrZoneScale.nelmFromSqm(sqm); final bool usable = dark && cloud <= cloudUsableMax && nelm >= nelmUsableMin; final double utility = usable ? (1 - cloud) * relativeStarCount(nelm) : 0; return SkyHour( dark: dark, cloud: cloud, rArt: rArt, bMoon: bMoon, sqm: sqm, nelm: nelm, usable: usable, utility: utility, );}/// The run of usable hours with the greatest summed utility, or null. Ties go to the earlier run.static SkyWindow? bestWindow(List<SkyHour> hours, {int minHours = minWindowHours}) { SkyWindow? best; double bestUtility = 0; int i = 0; while (i < hours.length) { if (!hours[i].usable) { i++; continue; } int j = i; double total = 0; while (j < hours.length && hours[j].usable) { total += hours[j].utility; j++; } if (j - i >= minHours && total > bestUtility) { best = SkyWindow(i, j); bestUtility = total; } i = j; } return best;}/// Angle between two directions given as altitude and azimuth in degrees.static double angularSeparationDeg(double alt1, double az1, double alt2, double az2) { final double a1 = _rad(alt1); final double a2 = _rad(alt2); final double c = math.sin(a1) * math.sin(a2) + math.cos(a1) * math.cos(a2) * math.cos(_rad(az1 - az2)); return _deg(math.acos(c.clamp(-1.0, 1.0)));}